|
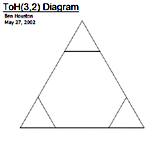
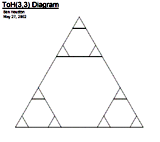
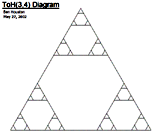
For 3-peg Tower of
Hanoi, the state transition graph is familiar to many (see the three
diagrams immediately below.) For larger and larger numbers of
discs, these graphs are better and better approximations to the Sierpinski
Gasket triangular fractal; see [Bogomolny] for an explanation of why this
occurs. Analysis of these approximation graphs and some inferences for the
properties of the Sierpinski Gasket are in [Hinz and Schief 1990]. However, the corresponding
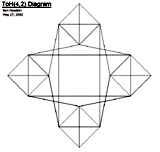
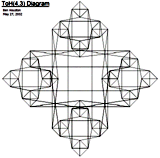
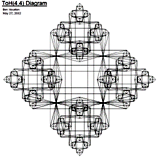
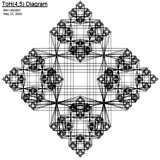
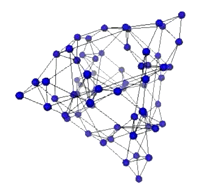
graph for 4-peg Tower of Hanoi is not obvious, and so we experimented
with several different layouts. It is of interest to try to and a layout
for 4-peg Tower of Hanoi which shows some of the patterns of the state
transition graph in an understandable way. These graphs have interesting
regularities which may aid in analysis. Is there a
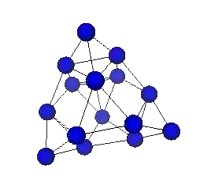
natural 3-dimensional representation generated by the state transition
graph for 4-peg Tower of Hanoi? The representations are not just finite
approximations to the "Sierpinski Tetrahedron" in 3-space as one might
first guess, as the graph contains many more edges. Not much is known yet
about this graph, aside from basic information about the number of edges [Klavzar
1998], and the fact that it is non-planar for 3 or more discs [Hinz and
Parisse 2002].
For more information please see:
|
